Mysupplier Creates a Safe Ice Rink and Boosts Customer Confidence with Piera Systems’ Technologies

As the world emerges from a pandemic, there are still many lingering worries about how to live, work, and play safely in a post-pandemic world. What we took for granted before the pandemic—a routine commute to work in the morning and taking kids to the ice rink in the evening — have become exercises in interpreting byzantine scientific theories or, more likely, leaps of faith that it’ll all be okay. Providing customers and employees the confidence that your space is clean and safe for them to come back to continues to be an existential imperative for buildings and facilities owners around the world.


Read more on how Mysupplier and Piera Systems deployed cutting edge technology to keep customers safe in an Atlanta ice rink.


Monitoring Indoor Air Quality Improves Health, Productivity

Every day we learn more about the impact poor air quality has on our health, productivity, and its economic impact.  Covid and climate change are tipping points for action.  Wildfires are impacting millions across the US.  What can I do to mitigate these threats to my family, business, the planet?  You don’t need to be an atmospheric scientist nor spend money on air purification technologies.  Start with monitoring the air indoors – at your office and home. You spend 80 % of your time indoors and indoor air quality is 2-5 times worse than outdoors.  Indoor air pollution is ranked as one of the EPA’s top 5 environmental risks to public health and there have been numerous studies linking indoor air quality to illness[1].  The EPA reports only outdoor air pollution caused by coarse (PM10) and fine (PM2.5) particulate matter alongside gases.  Indoor air quality is different, with sources infiltrating from outdoors but additionally from people and their activities.   It’s the ‘very fine’ (PM1.0 to PM0.1) particles that are most dangerous to your health (wildfire smoke, cooking, tobacco, wood stoves, dust, vape, etc.).  They are also invisible, readily absorbed into the bloodstream.

As a result of Covid-19 and its transmission in aerosol form, the EPA, CDC, DOE and WHO have released guidelines for reducing transmission by up to 50 % by; increasing the flow of ‘fresh’ (outside) air;  the use of MERV-13 filtration in the HVAC system; augmenting this with air cleaning technologies which have a CADR (Clean Air Deliver Rate) sized to the room they are used in.  Researchers also recommend measuring the effectiveness of these approaches through testing of particle count and size using low-cost Air Quality Monitors [2].

What if there was a low cost, real time way to monitor indoor air especially very fine particles, determine when it’s bad, identify possible sources, and take steps to improve and remove it?  You could answer these questions:

  • Is my Indoor Air Good ?  If not, what is the source?
  • Is my HVAC system making it better or worse? Do the filters need to be changed?
  • Am I getting enough fresh air into the home? Is the outdoor air ‘good’?
  • Are some rooms in my building ‘bad’? Is this a short-term event or longer, what could be the source?
  • Do I need to buy air purification technologies to complement my HVAC system? If so, how do I know if they are effective?

At Piera Systems, our technology originally developed to detect X-Rays by counting photons has been adapted to measure and count all sizes of particulate matter and forms the brains of our Intelligent Particle Sensor (IPS) used in our Canāree Air Quality Monitors.  No other sensor currently available can measure coarse, fine and very fine particles and deliver the data needed to measure the effectiveness of any mitigation.  Its data can alert you to bad air events, the magnitude and duration, classify possible sources, suggest steps to mitigate, and monitor their effectiveness.

Don’t wait for the EPA, the CDC and the WHO, take action by knowing What’s in your Air?

[1] https://www.hsph.harvard.edu/c-change/?utm_source=os&utm_campaign=redirect_analysis

[2] EPA Webinar: Navigating the Landscape of Air Cleaning Tech for Covid-19, June 16, 2021


Wildfire Smoke Reaches the Eastern Seaboard

Yesterday (7/20) I noticed that my Canāree A1 located in my office in Bristol, RI started reading AQI values ~120 (orange, unhealthy) after weeks of green values. I wondered why?

Went out for a cruise on Narragansett Bay from 7-9 pm and the air smelled like burnt wood, the sky was hazy with a yellow/orange moon. I overhear someone say it’s due to wildfire smoke. I think she’s mistaken.

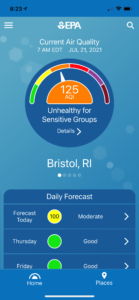
This morning at 6:30 AM, Canāree continues to show unhealthy air. I take a 4.5 mile walk outdoors, same smell and the Boston NPR radio station states haze from wildfires in Western US (Oregon and California) would affect us all day. Checked AirNow, the EPA site and saw same warning with PM <2.5 being most of it. This station is in Fall River ~20 miles away.

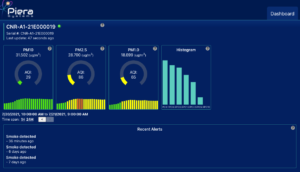
To the left is the Canāree indoor data for the last 24 hours. The historical data from my Canāree is here. Note the increase in PM2.5 and 1.0 ~3 pm yesterday when wildfire smoke entered the area. I also have a Sensirion SPS30 PM sensor which reports about half the amount of PM and identical values for PM10, 2.5, 1.0 so it doesn’t see the <1.0 PM values, can’t report smoke and is off by 50 %.

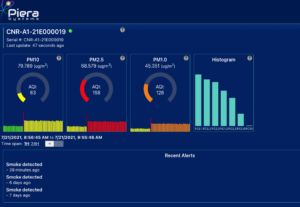
This morning at 9:15 AM I moved the Canāree and Sensirion outdoors. It detected a smoke event within minutes as all 3 PM values spiked with the majority being PM 1.0 and below. This real-world example shows how Canāree detects wildfire smoke in real time, its intensity and size. The forecast is for the air to improve and clear throughout the day.

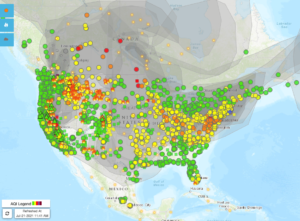
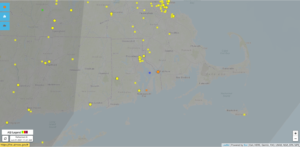
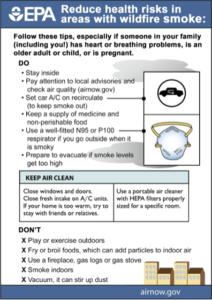
Coincidentally, two days ago, the EPA published this bulletin on Wildfire Smoke and Indoor Air Quality. They recommend two steps; monitor the levels in your area using the Fire and Smoke Map from Airnow.gov and take steps to mitigate. Here is the Fire and Smoke Map for US and my area including that sensor in Fall River, the orange dot to the right of the blue one (me in Bristol).

Since the EPA stations are far apart, report every hour and the AQI is a 24-hour average you can’t rely on it to help you know the local conditions. It’s value is more of an early warning system. The AQI in Bristol was 158 and red 50 % higher than Fall River at 121 and orange. PM 1.0 is 46 ug (mass concentration, a measure of the weight of all the particles) with PM2.5 = 68 ug. So, 68 % is PM <1.0 which the EPA doesn’t report (just < PM2.5 and 10). The recommended daily average value for PM 2.5 is 12.5 ug so we are breathing 4x with most of that PM 1.0!!! This is a serious health threat and Canāree reports more accurate, real-time updates that reflect your local conditions and can augment the EPA Fire and Smoke Maps.

What should I do? Should I mask up, get an air purifier? Stay indoors? EPA guidelines include:

• Close windows and doors
• Close fresh intake on A/C units
• Use a portable air cleaner with HEPA filters properly sized for the room in your home.
• If your home is too warm, try to stay with friends or relatives

Hopefully they have a clean room

Follow the guidelines but continue to monitor to determine their effectiveness. Canāree will help you see in real-time if these steps are working. Real world testing at our Mt. Shasta location during the Lava fire suggests a properly sized air purifier works quickly. What size? CADR is one key metric, find out more here or use the CADR size calculator here. Just remember that you’ll need to monitor the purifier to see how well it’s working and if the filters need replacing.

In summary, Canāree is the only indoor AQM that can classify sources like vape, smoke, etc. It will monitor your indoor air quality and help you improve it cost effectively. Contact us at www.pierasystems.com to learn more.